Home Buyers Eager to Act Sooner Rather Than Later

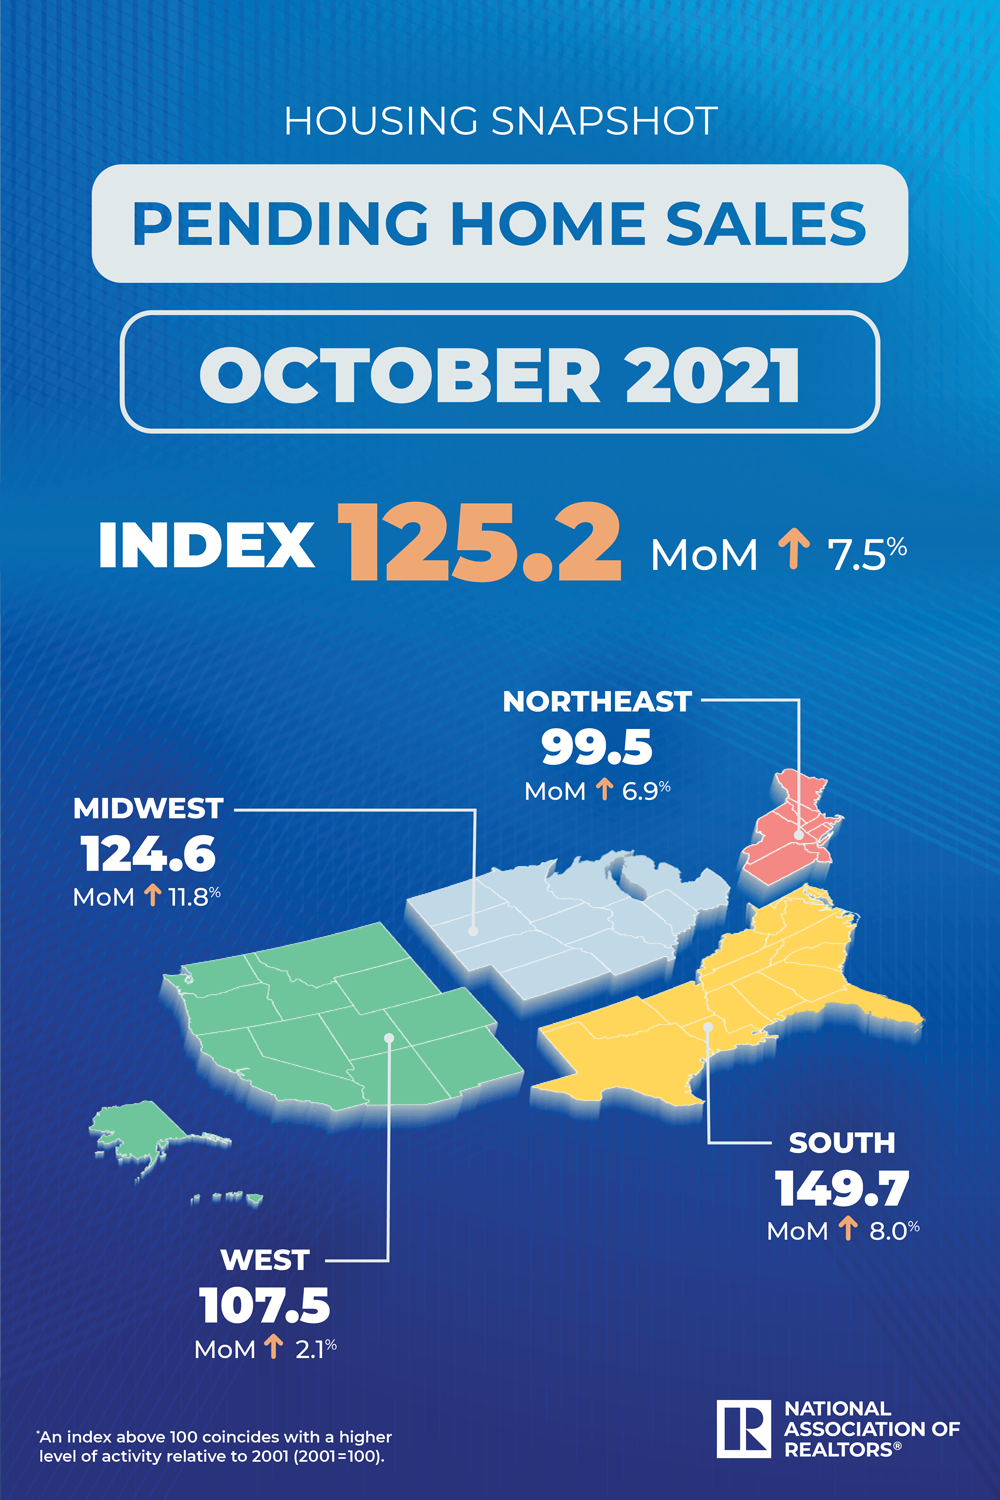
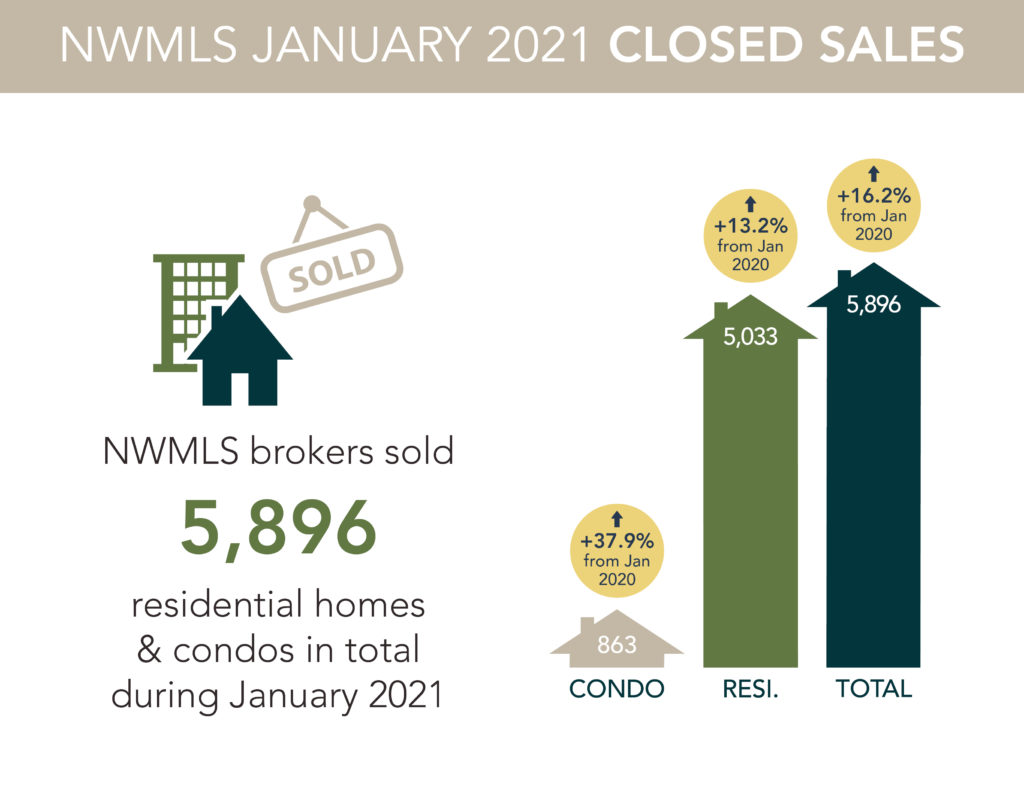
Contract signings climbed 7.5% in October, and home sales for 2021 are on pace to hit a 15-year high, the National Association of REALTORS® reported Monday. Pending home sales rebounded after a decline in September.

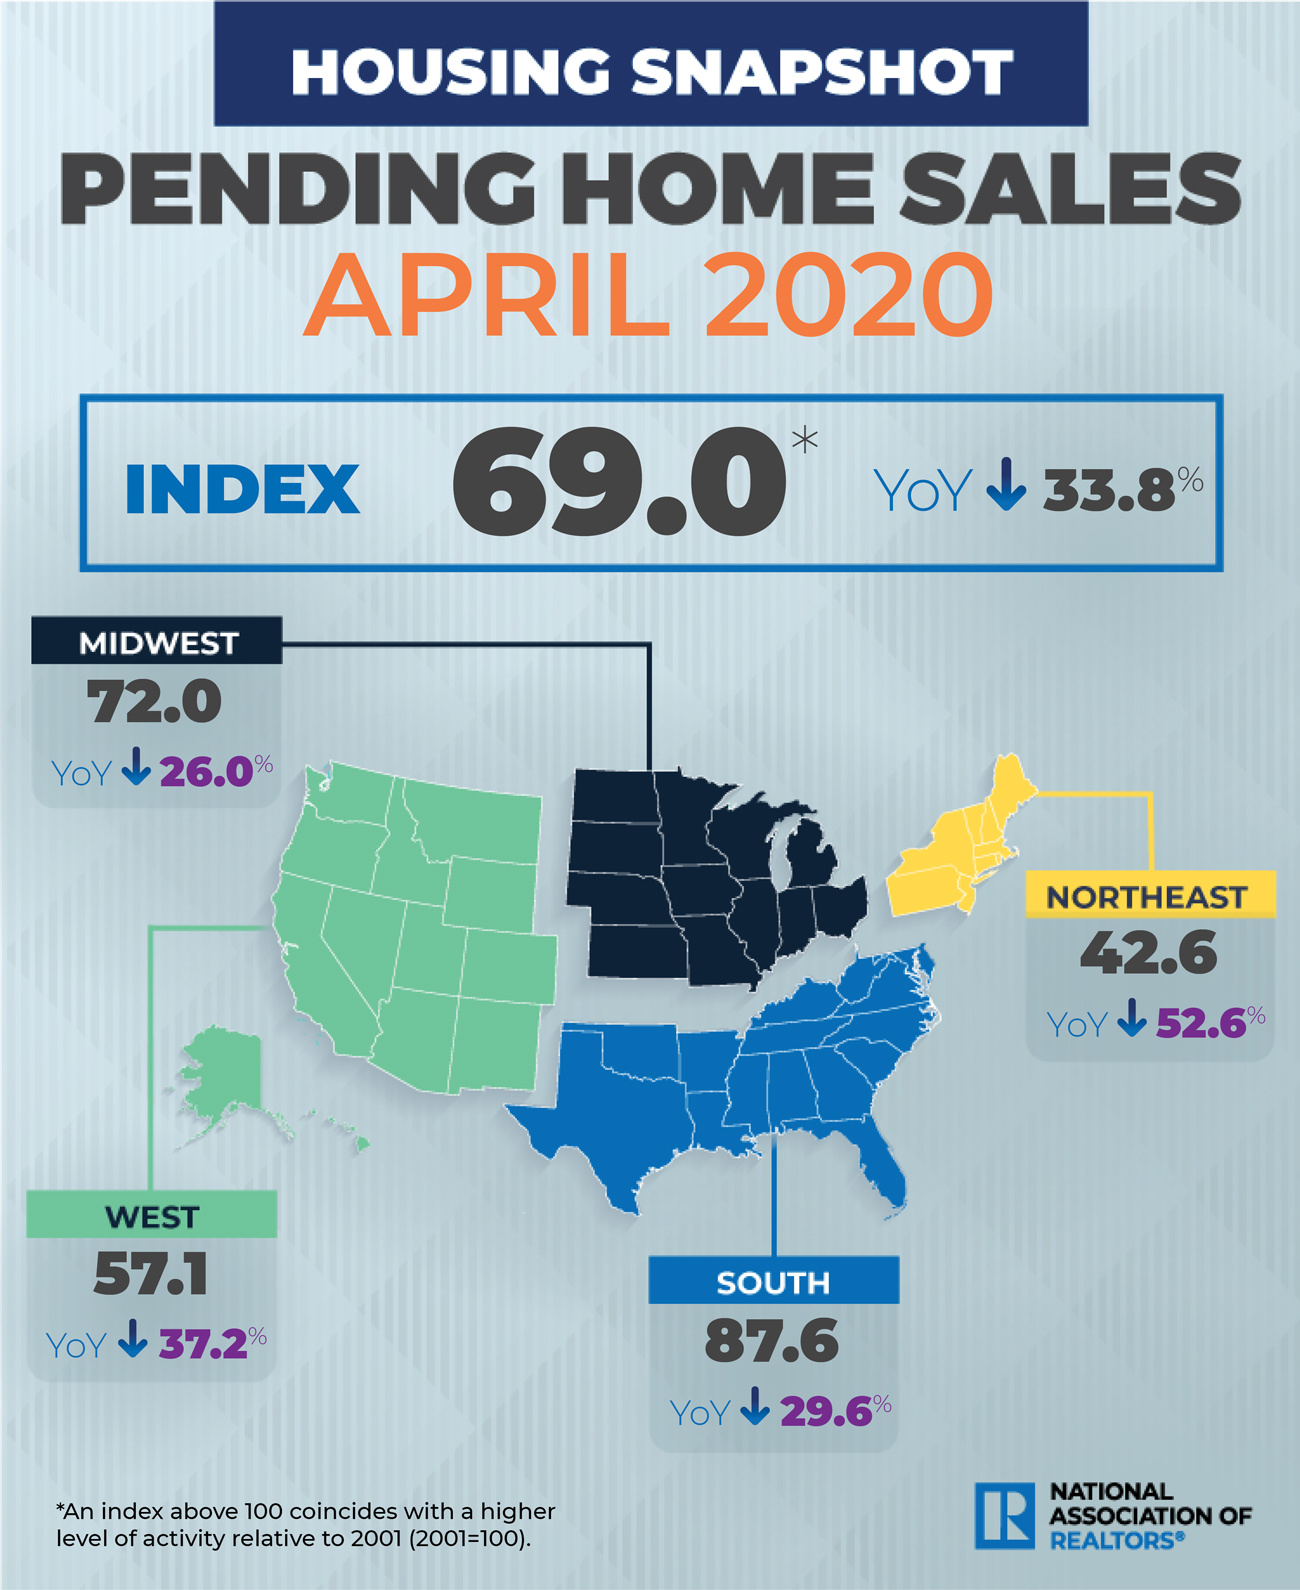
Despite rising mortgage rates, home buyers appear undeterred by higher financing costs and home prices. Contract activity increased month over month in all four major regions of the U.S. NAR’s Pending Home Sales Index is a forward-looking indicator of home sales based on contract signings.

“Motivated by fast-rising rents and the anticipated increase in mortgage rates, consumers that are on strong financial footing are signing contracts to purchase a home sooner rather than later,” says Lawrence Yun, NAR’s chief economist. “This solid buying is a testament to demand still being relatively high, as it is occurring during a time when inventory is still markedly low.”

Yun notes that the gain in October assures that total existing-home sales in 2021 will exceed 6 million. That will mark the top performance in home sales in 15 years, Yun says.

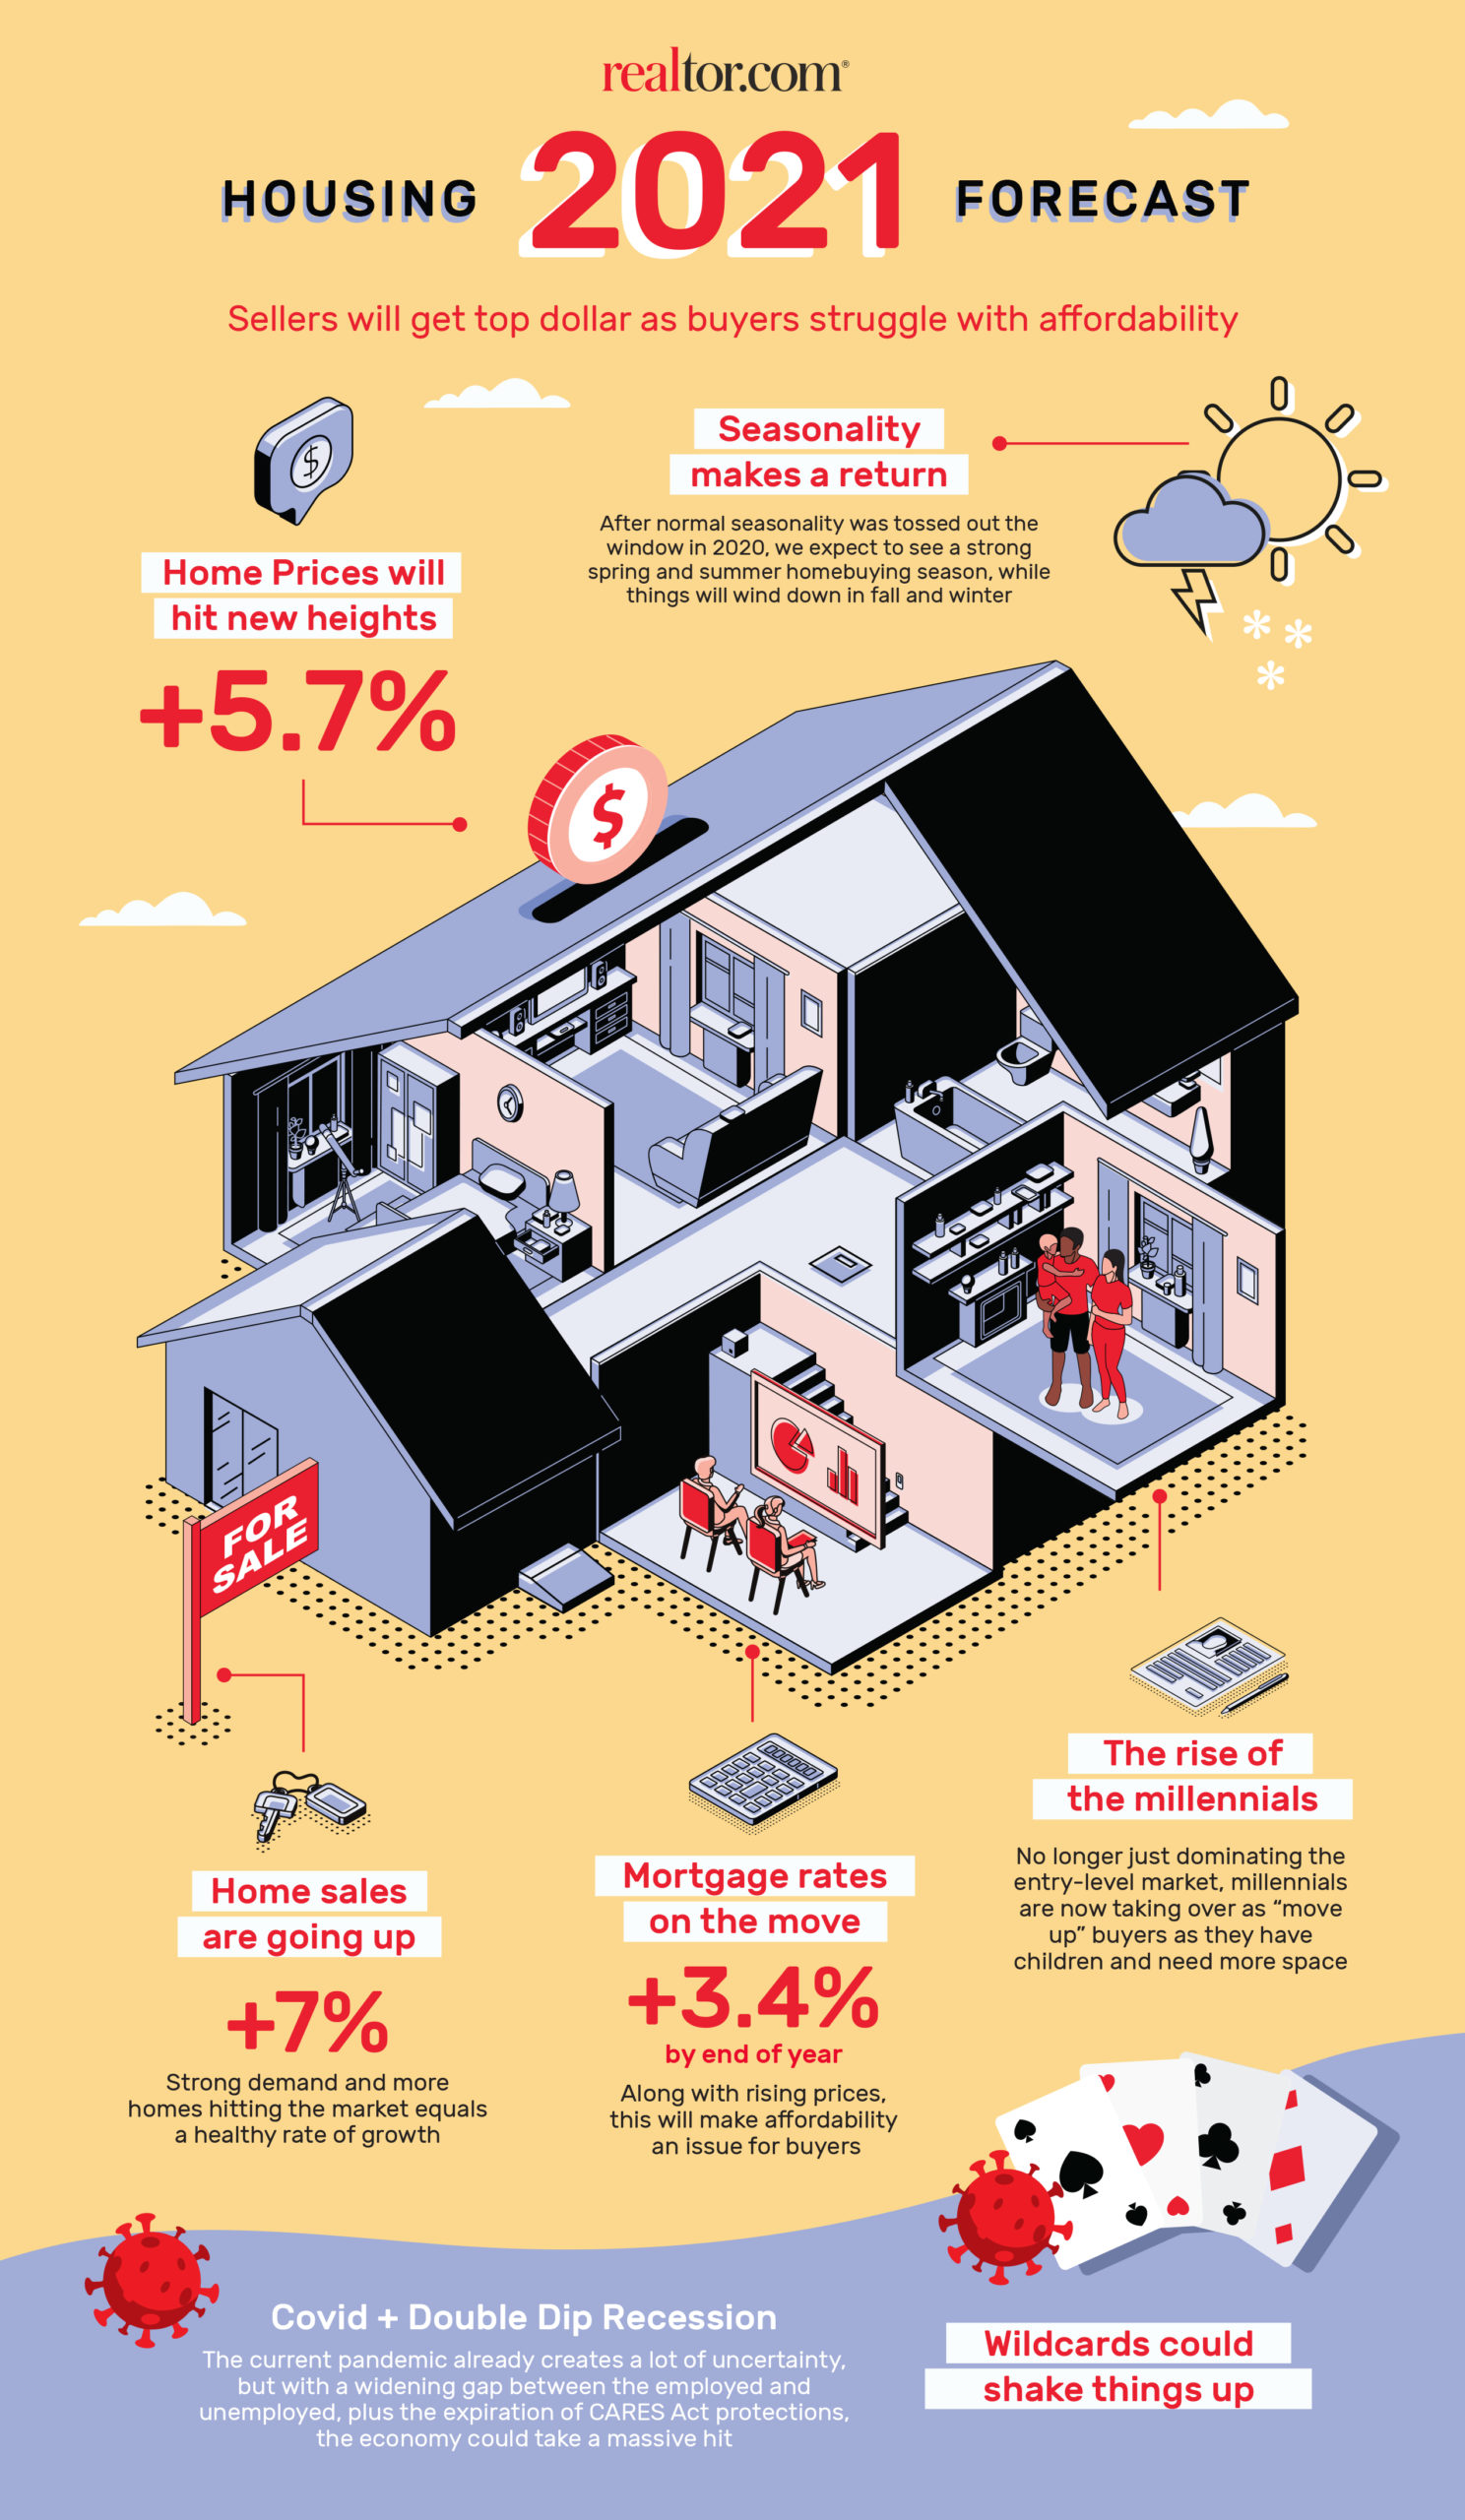
He does forecast, however, home prices will increase at a “gentler pace” over the next several months and expects demand to be milder as mortgage rates increase. The 30-year fixed-rate mortgage averaged 3.10% last week, up from a 2.72% average a year ago, Freddie Mac reports.

Last month, contract signings increased at the strongest pace in the Midwest and South regions. The Northeast increased 6.9% in October, but contract signings are still down 10% from a year ago. The Midwest saw contract signings climb 11.8% in October; pending home sales are up 5.1% from a year ago.

Homes in 10 Hottest Markets Are Selling in 6 Days

Homes are selling faster than ever—in less than a week in the country’s most active housing markets.

Realtor.com® released a new report revealing housing’s top 10 ZIP codes for 2021. This year’s list showed some of the most significant drivers behind the hottest markets:

  • Housing affordability with asking prices that offer bigger houses for the money
  • A growing number of high-income millennials
  • Close proximity to local amenities and outdoor activities

“The ZIPs that make our annual hottest report are very competitive, but this year, they are white hot,” says Danielle Hale, realtor.com®’s chief economist. “Homes in this year’s ZIPs are under contract in less than a week, which is three times faster than the contract times for last year’s hottest markets. While there’s no question that buyers have faced a challenging housing market during the pandemic, our hottest ZIPs list also highlights some of the silver linings. The rise in remote work has given some buyers more flexibility to live wherever they want, and many are finding larger homes at lower prices, as well as a higher quality of life, in the 2021 hottest ZIPs.”

Homes are selling in the top 10 markets an average of six days—31 days faster than the rest of the country. Home listing views on realtor.com® are up 156% compared to a year earlier.

20 Cities With the Most Severe Housing Shortages

The inventory shortage, which has been a nuisance for years now, is causing even greater disruption since the pandemic began. Fueling intense buyer competition and sky-high home prices, the historic supply crunch requires a “once in a generation” federal response to address decades of underinvestment and underbuilding, argues the National Association of REALTORS®.

There are areas of the country that exemplify the problem and support NAR’s urgent call. DeedClaim, an online deed preparation service, analyzed the 50 largest metros to identify the markets with the biggest housing deficits. The site crunched realtor.com® data to determine each metro area’s supply levels and analyzed population changes to find where the lowest amount of available housing is compared to demand.

Phoenix and Dallas topped the list with the biggest housing shortages. Cities in Southern states tended to have the largest housing shortages, according to the study.

Monthly Market Snapshot Infographic & Video

2021 Housing Market Forecast and Predictions

2021 National Housing Market Forecast and Predictions: Back to Normal

To say 2020 was a year of surprises is an extreme understatement. What started off as a bright year for the housing market and the economy was soon derailed by a global pandemic and severe economic recession. As detailed by my colleague, George Ratiu, the economic rebound has been sharp, but is by no means complete and created distinct winners and losers among sectors in the economy. Read more detailed thoughts on the overall economic context and outlook, here. One of the big winners has been the housing market, which saw home sales and prices hit decade-plus highs following decade lows in the span of just a few months. We expect housing’s winning streak to continue in 2021 as seasonal trends normalize and some of the frenzied momentum fades thanks to fresh affordability challenges. Below you’ll find our forecast and housing market predictions on key trends that will shape the year ahead.

Realtor.com 2021 Forecast for Key Housing Indicators

Housing IndicatorRealtor.com 2021 Forecast
Mortgage RatesAverage 3.2% throughout the year, 3.4% by end of year
Existing Home Median Sales Price AppreciationUp 5.7%
Existing Home SalesUp 7.0%
Single-Family Home Housing StartsUp 9%
Homeownership Rate65.9%

Nationwide Housing Snapshot

The COVID-19 pandemic hampered home sales contracts in April, but that will likely mark the low point in pending home sales for the year, according to the National Association of REALTORS®’ latest housing report released on Thursday. April was the second consecutive month of declining pending home sales, as social distancing measures and widespread business closures mounted due to the igniting coronavirus outbreak. Every major region of the country saw a drop in month-over-month contract activity in April.

NAR’s Pending Home Sales Index—a forward-looking indicator of home sales based on contract signings—fell 21.8% in April. Contract signings were 33.8% down for the year. April’s decline also marked the greatest decrease in pending home sales since NAR began tracking such data in January 2001.

“With nearly all states under stay-at-home in April, it is no surprise to see the markedly reduced activity in signing contracts for home purchases,” says Lawrence Yun, NAR’s chief economist.

Yun expects April’s pending home sales to be the lowest point for the year, and the month of May to, therefore, be the lowest point for closed sales. He then predicts a rebound in the housing market in the summer months.

“While the coronavirus mitigation efforts have disrupted contract signings, the real estate industry is ‘hot’ in affordable price points with the wide prevalence of bidding wars for the limited inventory,” Yun says. “In the coming months, buying activity will rise as states reopen and more consumers feel comfortable about home buying in the midst of the social distancing measures.”

More reason behind housing’s optimism: Mortgage applications have been rising over the last few weeks, a gauge used to measure future home sales.

How long do homeowners stay in their homes?

Owners typically stay fewer years in their homes in metro areas with a high concentration of new residents, a NAR analysis shows.

As of 2018, the median duration of homeownership in the U.S. is 13 years1. Compared to previous years, homeowners opt to spend more time holding onto their residences. Median tenure has increased by 3 years since 2008.

Nevertheless, homeownership duration varies from area to area. Homeowners in some metro areas move more frequently than homeowners in the rest of the country. To begin our analysis, we looked at the median years of residence for owner-occupied homes located in the 100 largest U.S. metro areas. The American Community Survey provides estimates about the median year that owners moved into their homes. As data shows, homeownership duration varies from 6 to 18 years in the 100 largest metro areas. In more than half of these metro areas, homeowners spend less time holding onto their primary residences than the typical homeowner across the country. 

Specifically, homeowners in the following areas typically stay up to 8 years in their homes:

Map of the US: Where Owners Spend Less Time Holding onto Their Homes

In contrast, the following metro areas had a median homeownership duration of 16 years and higher:

Map of the US: Where Owners Stay Longer in Their Homes

As the data shows, many of the fastest-growing metro areas had the lowest median tenures. For instance, in Austin-Round Rock, TX, owners typically stay for 8 years in their homes while 18 percent of the total population moved within the last 12 months in 2018. Respectively, in Colorado Springs, CO the median homeownership duration was 8 years while the share of recent movers was 21 percent.

In contrast, in New York-Newark-Jersey City, NY-NJ-PA where fewer people moved recently (9%), the typical homeowner stayed for 15 years. Similarly, the median homeownership duration was 15 years in Los Angeles-Long Beach-Anaheim, CA while 9 percent of the total population moved within the last 12 months.

Housing supply shortage and low affordability are two of the main reasons that people stay longer in their homes. Firstly, the number of building permits for single-family homes issued in 2018 compared to a year earlier was lower in the metro areas with median homeownership duration above 13 years. While there are fewer inventory options, sellers in these areas may find it harder to find and purchase their next homes. Thus, they stay longer in their homes and fewer homes are available for first-time homebuyers. On the contrary, permits increased by 4% in the metro areas where homeowners stay less than 13 years in their homes.

Moreover, housing is more expensive in the areas with the highest median tenures. Although short supply increases the seller’s profit, it also difficult for these sellers to afford to purchase their next homes. As data reveals, the median home price of recently purchased homes was 10 percent higher in the areas with a median homeownership duration above 13 years compared to other metro areas.

Homeowners staying longer in their homes can further reduce the number of homes for sale. Homeowners will likely be further locked in place because it is difficult to sell and buy a home at the same time. That being said, finding ways to build more housing will help, but the ultimate goal is to increase the number of existing homes available on the market. This can only happen if these existing owners’ homes go on the market.

However, metro areas with smaller homeownership duration are expected to have a boost of housing activity in the upcoming years. Since these areas have more homes available for first-time homebuyers than other metro areas, more newcomers will likely arrive. As first-time homebuyers become a greater proportion of all homeowners, the median homeownership duration will fall further in these areas.

Hover over the map to see how long owners of different metro areas opt to stay in their homes.

  • In green metro areas, homeowners spend less time holding onto their residences compared to nationwide
  • In grey metro areas, homeowners spend 13 years
  • In orange metro areas, homeowners spend more time holding onto their residences compared to nationwide

Homes Are Selling Quickly

  • The National Association of REALTORS® surveyed their members for the release of their Confidence Index.
  • The REALTORS® Confidence Index is a key indicator of housing market strength based on a monthly survey sent to over 50,000 real estate practitioners. Practitioners are asked about their expectations for home sales, prices, and market conditions.
  • Homes across the country are selling quickly, in an average of just 31 days.
  • 49% of homes sold in less than a month.

4 Reasons to Sell Your Home This Fall

  • Buyers are active in the market and often competing with one another for available listings.
  • Housing inventory is still under the 6-month supply found in a normal housing market.
  • Homes are still selling relatively quickly, averaging 31 days on the market.