Why is the United States Homeownership Rate Stuck at 1965 Levels?
September 23, 2019 By Leave a Comment
The Housing Shortage in Perspective
September 15, 2019 By Leave a Comment
Why inventory has been shrinking.
Existing Home Sales Point Toward a Good Time to Sell
August 5, 2019 By Leave a Comment
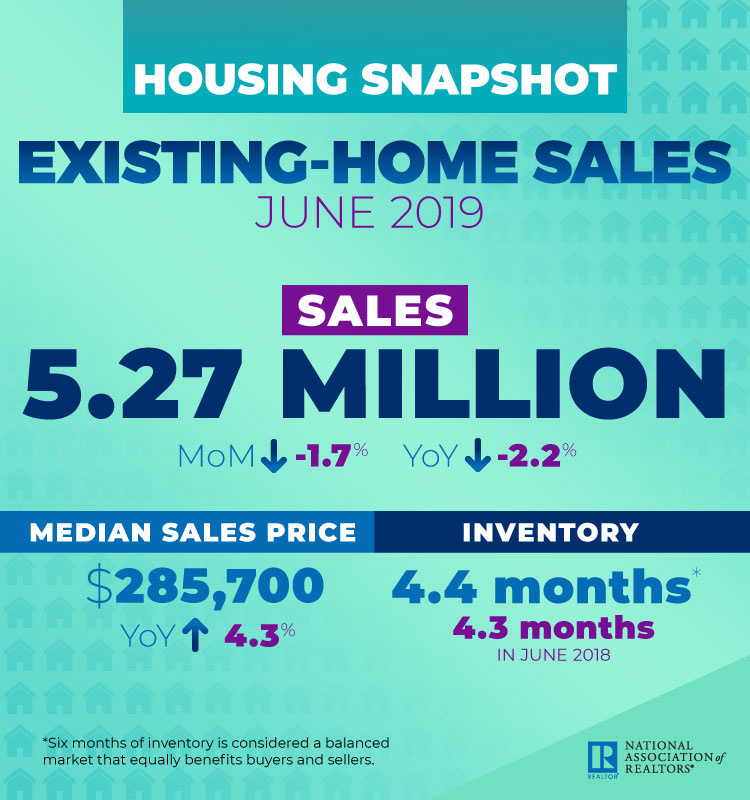
- Existing Home Sales dropped 1.7% from May to a seasonally adjusted annual rate of 5.27 million in June.
- Low inventory levels are still a factor in the market. The current supply of homes for sale is at 4.4 months, which is less than the optimal 6-month supply.
- Median home prices were up 4.3% from June 2018, hitting $285,700. This marked the 88thconsecutive month with year-over-year price gains.
Why Home Sales Are Falling Against a Strong Economy
July 25, 2019 By Leave a Comment
Despite mortgage rates dipping below 4%, more jobs filled than ever before, and record-high consumer net worth, existing-home sales turned south in June, running at a pace similar to 2015 levels, the National Association of REALTORS® reported Tuesday. While economic indicators portend a strong housing market, low supply on the lower end—which leaves first-time homebuyers with few options—is helping to hold sales back, NAR Chief Economist Lawrence Yun says.
Total existing-home sales, comprising transactions for single-family homes, townhomes, condos, and co-ops, dropped 1.7% month over month in June to a seasonally adjusted annual rate of 5.27 million, according to NAR. Sales are down 2.2% from a year ago. Two of the four major U.S. regions, the Northeast and Midwest, recorded minor sales increases last month, while the South and West posted larger declines. “Imbalance persists for mid- to lower-priced homes, with solid demand and insufficient supply, which is consequently pushing up home prices,” Yun says.
The median existing-home price for all housing types reached a record high of $285,700 in June, up 4.3% from a year ago.
Yun says other factors besides high home prices and inventory shortages may also make buyers skittish. “Either a strong pent-up demand will show in the upcoming months, or there is a lack of confidence that is keeping buyers from this major expenditure,” Yun says. “It’s too soon to know how much of a pullback is related to the reduction in the homeowner tax incentive.”
Here’s a closer look at more key indicators in the housing market in June from NAR’s latest report:
- Inventory: Total housing inventory rose to 1.93 million in June, up from 1.91 million in May. But the June figure is unchanged from inventory levels a year ago. Unsold inventory is at a 4.4-month supply at the current sales pace.
- Days on the market: Fifty-six percent of homes sold in June were on the market for less than a month. Properties typically remained on the market for 27 days in June, up slightly from 26 days a year ago.
- Mortgage rates: The 30-year fixed-rate mortgage dropped to 3.80% in June, down from 4.07% in May, according to Freddie Mac. “Historically, these rates are incredibly attractive,” says NAR President John Smaby. “Securing and locking in a mortgage now—given the current favorable conditions—is a decision that will pay off for years to come.”
- First-time buyers: First-time buyers comprised 35% of sales in June, up from 31% a year ago.
- All-cash sales: Sixteen percent of transactions in June were paid in cash, down from 22% a year ago. Individual investors, who account for the bulk of cash sales, purchased 10% of homes in June, down from 13% a year ago.
Home Prices Up 5.73% Across the Country
March 3, 2019 By Leave a Comment
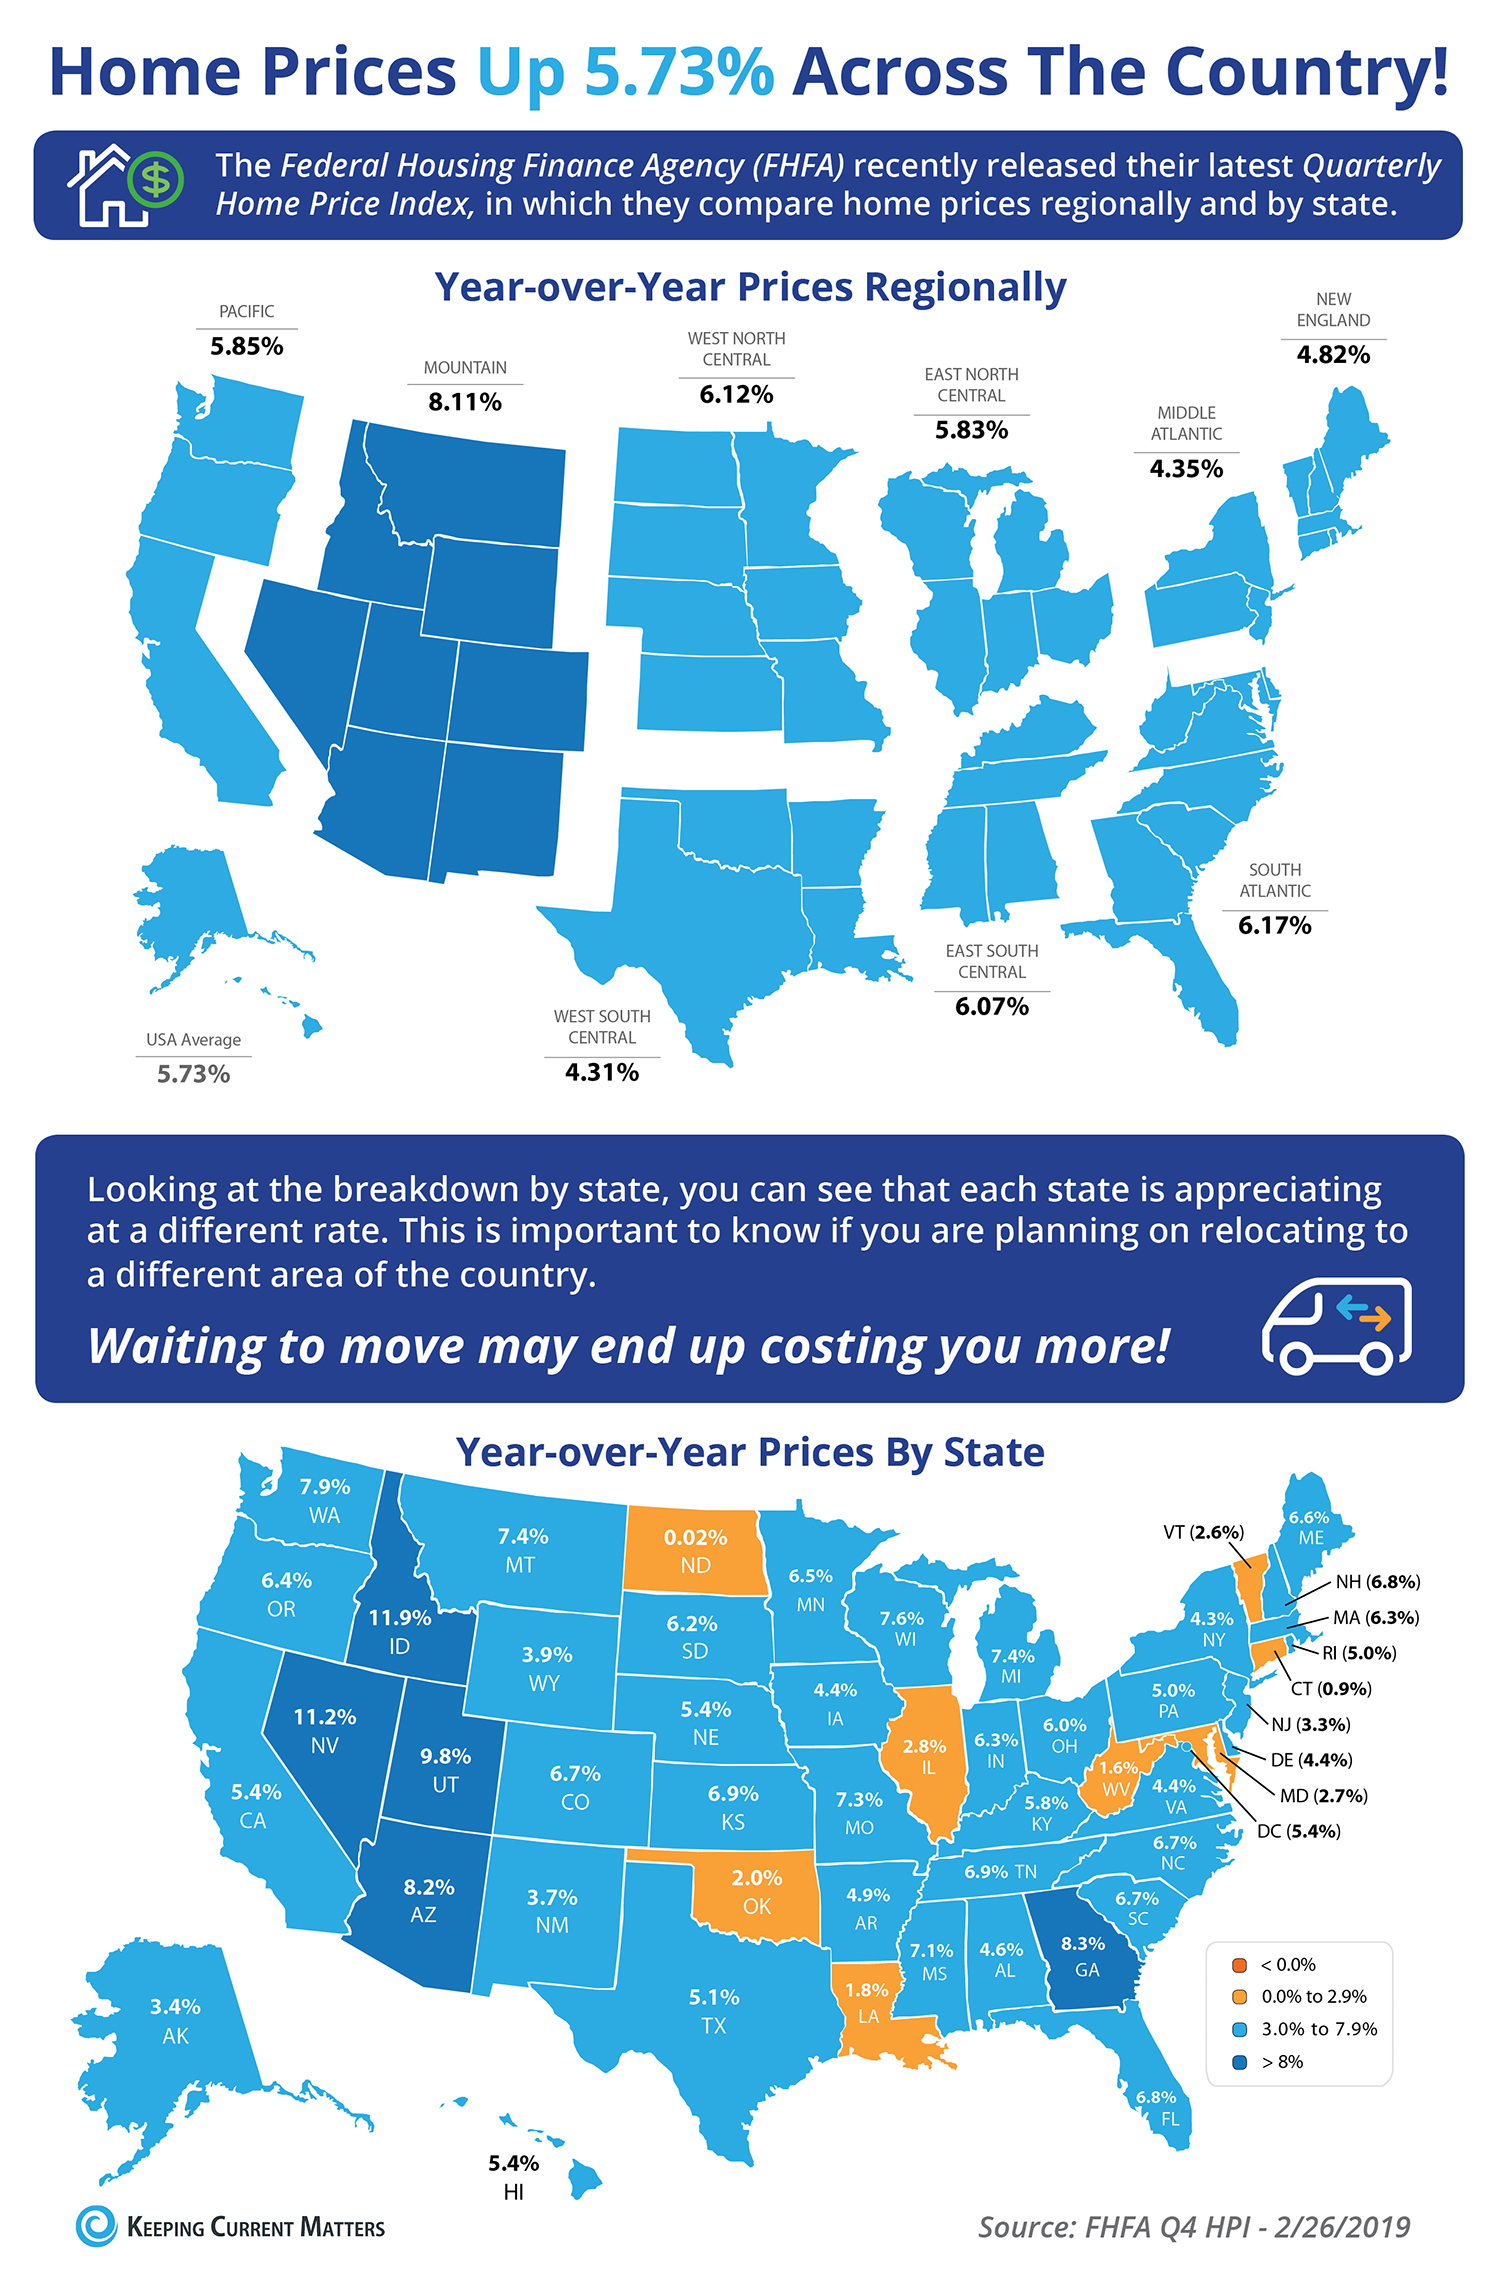
Some Highlights:
- The Federal Housing Finance Agency (FHFA) recently released their latest Quarterly Home Price Index report.
- In the report, home prices are compared both regionally and by state.
- Based on the latest numbers, if you plan on relocating to another state, waiting to move may end up costing you more.
What is the Cost of Waiting Until Next Year to Buy?
February 10, 2019 By Leave a Comment
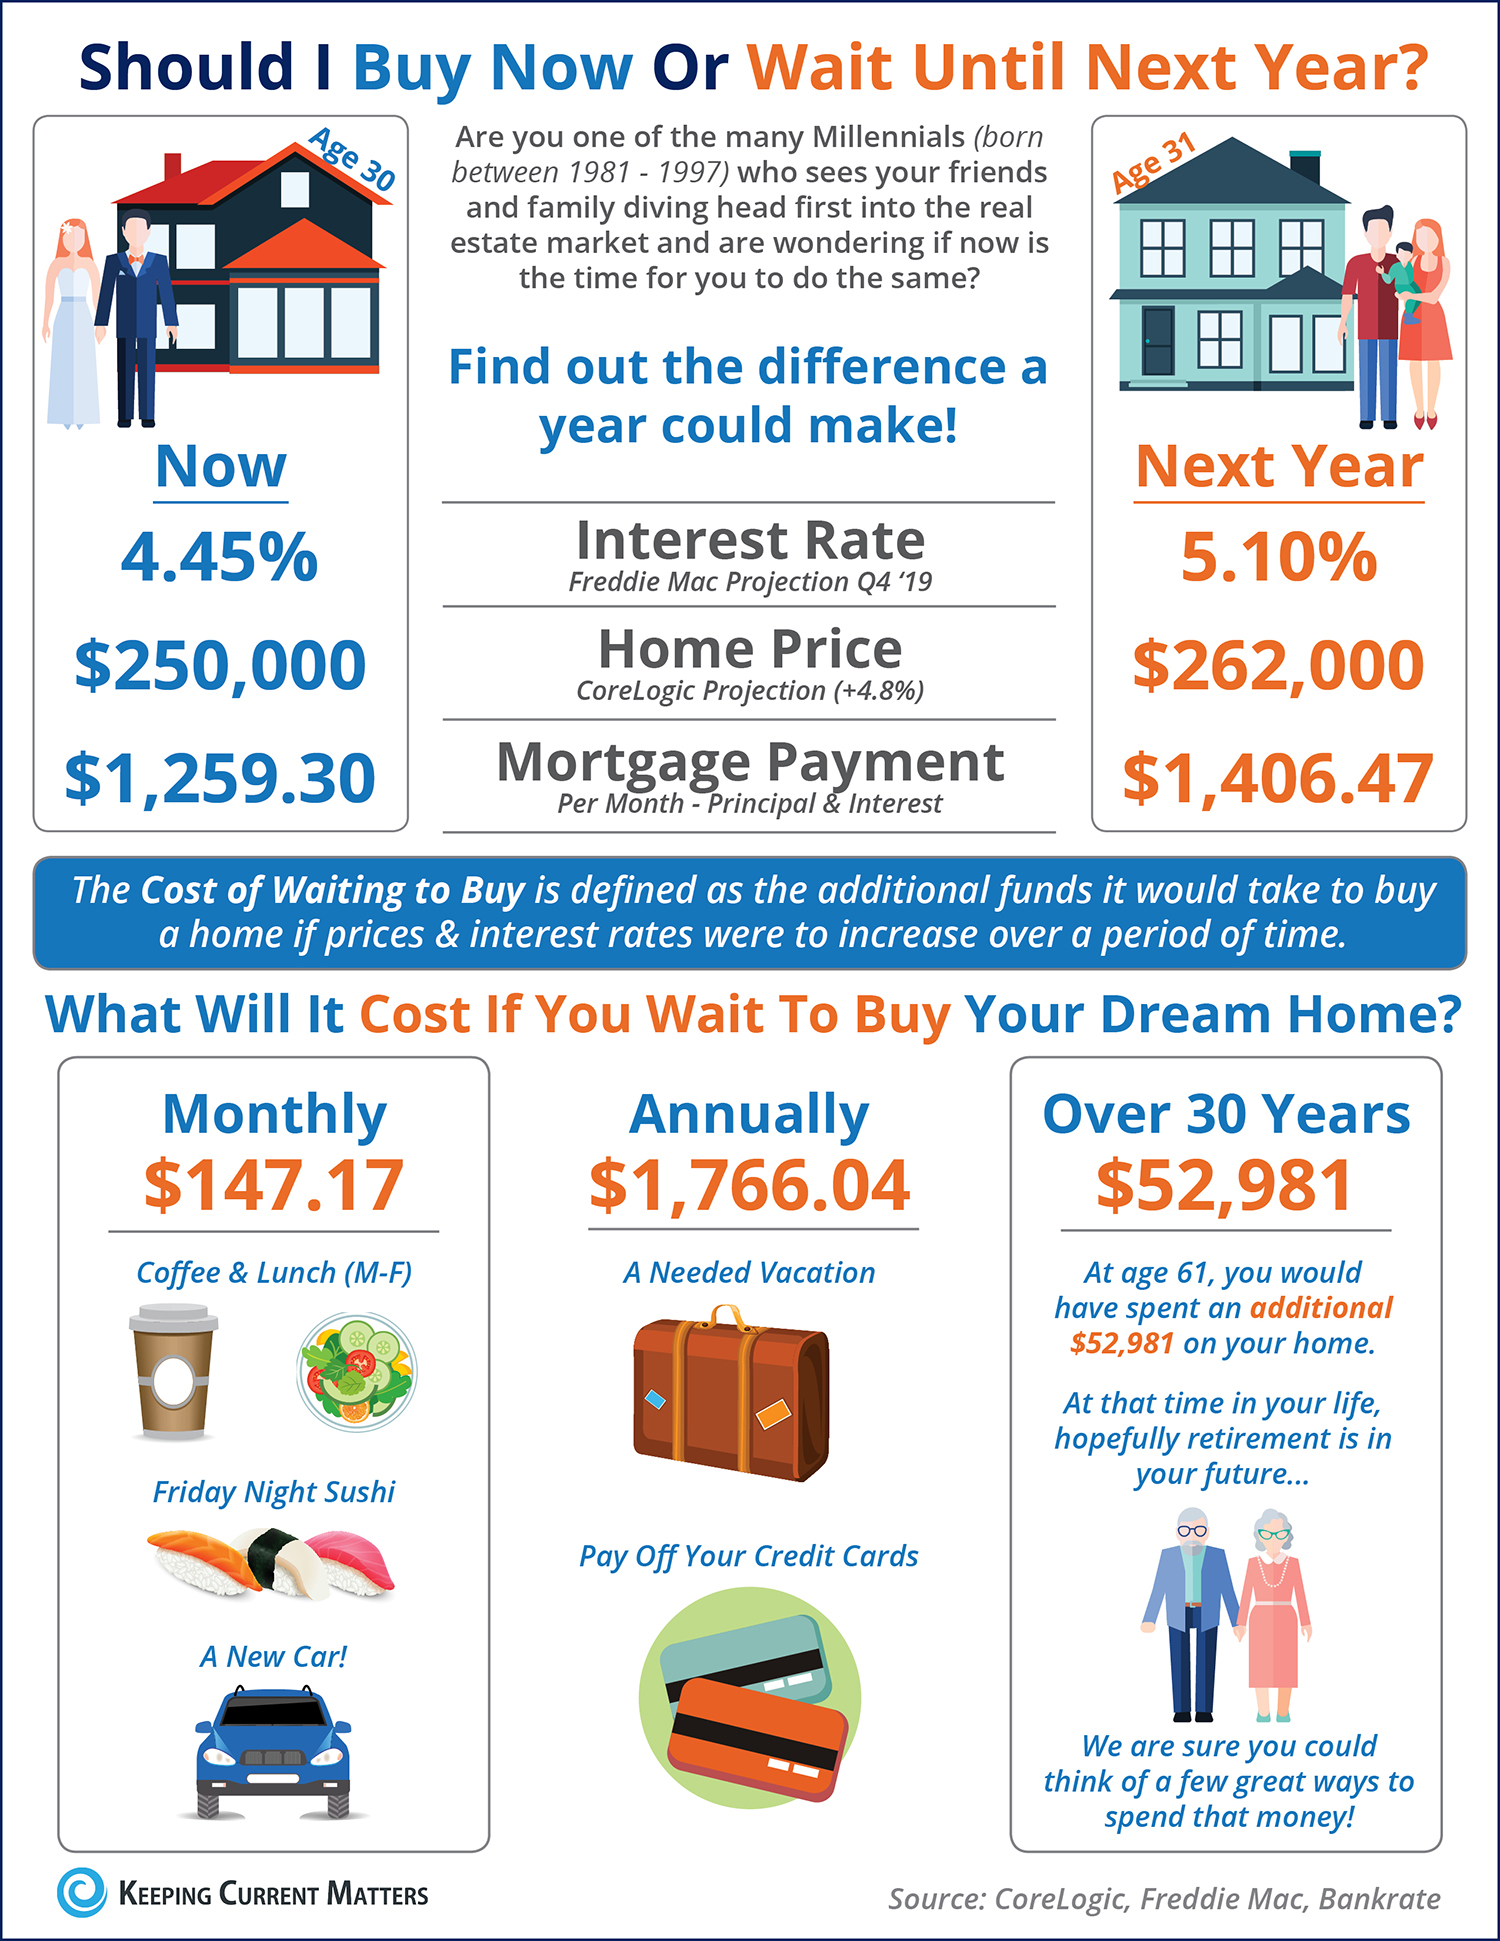
- The cost of waiting to buy is defined as the additional funds it would take to buy a home if prices & interest rates were to increase over a period of time.
- Freddie Mac predicts interest rates to rise to 5.1% by the end of 2019.
- CoreLogic predicts home prices to appreciate by 4.8% over the next 12 months.
- If you are ready and willing to buy your dream home, find out if you are able to. Contact me: emmanuel@EmmanuelFonte.com
Home Renovation Pros Paint a Bright Picture for the Rest of 2018
November 7, 2018 By Leave a Comment
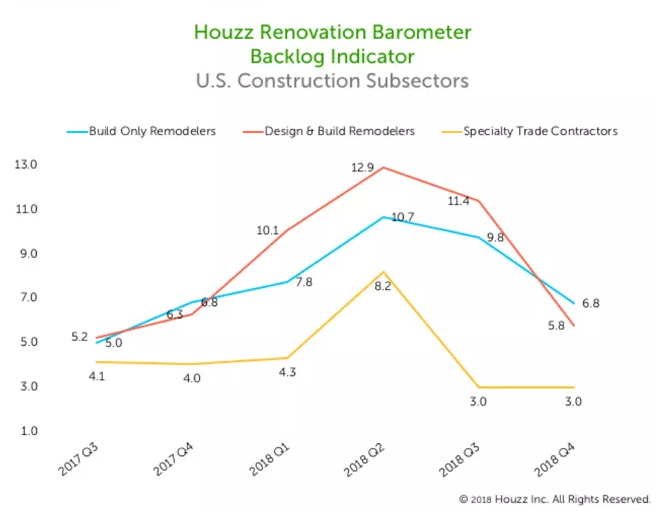 The Houzz Renovation Barometer for fourth quarter 2018 shows that wait times to work with a building firm have dropped
New data just out on the residential remodeling industry paints a rosy picture for firms in the industry. Firms expect business activity to rise during the final three months of 2018, the data shows. And homeowners may get some relief from long wait times to start their projects, as the average wait time for construction sector firms dropped to 4½ weeks from 6½ weeks during the previous three months.
“Home renovation professionals are clearly very upbeat about the year end, despite a number of challenges facing the industry today,” says Nino Sitchinava, principal economist at Houzz.
The data come from the Q4 2018 Houzz Renovation Barometer, which tracks residential renovation market expectations, project wait times and recent business activity. (Market expectations and business activity have been smoothed out to account for predictable seasonal fluctuations, while project wait times have not.) The Barometer is based on a quarterly survey of residential remodeling businesses with a profile on Houzz and garnered 1,750 responses. Read on to gain insights from what they said.