Why Home Sales Are Falling Against a Strong Economy

Despite mortgage rates dipping below 4%, more jobs filled than ever before, and record-high consumer net worth, existing-home sales turned south in June, running at a pace similar to 2015 levels, the National Association of REALTORS® reported Tuesday. While economic indicators portend a strong housing market, low supply on the lower end—which leaves first-time homebuyers with few options—is helping to hold sales back, NAR Chief Economist Lawrence Yun says.

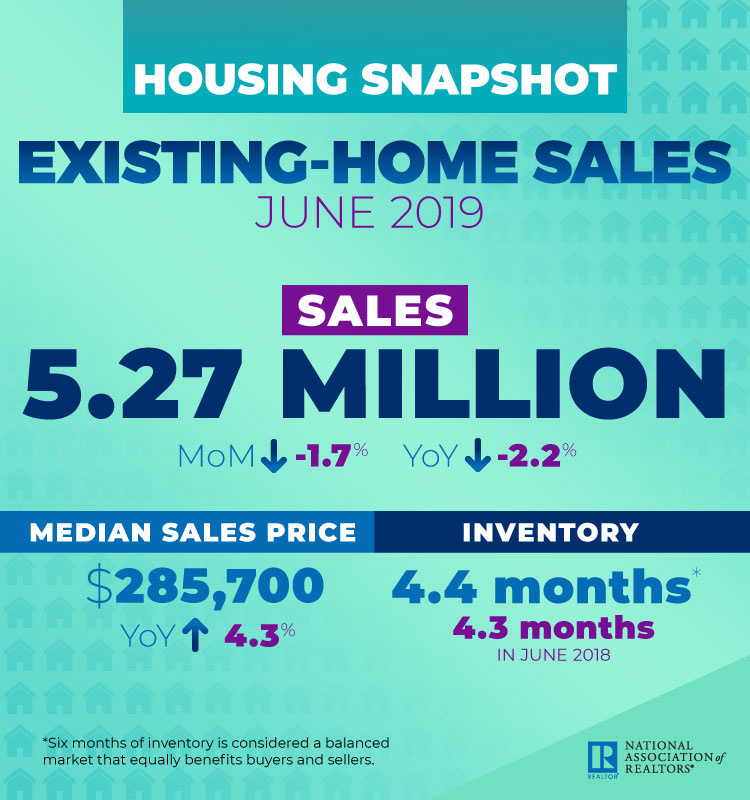
Total existing-home sales, comprising transactions for single-family homes, townhomes, condos, and co-ops, dropped 1.7% month over month in June to a seasonally adjusted annual rate of 5.27 million, according to NAR. Sales are down 2.2% from a year ago. Two of the four major U.S. regions, the Northeast and Midwest, recorded minor sales increases last month, while the South and West posted larger declines. “Imbalance persists for mid- to lower-priced homes, with solid demand and insufficient supply, which is consequently pushing up home prices,” Yun says.

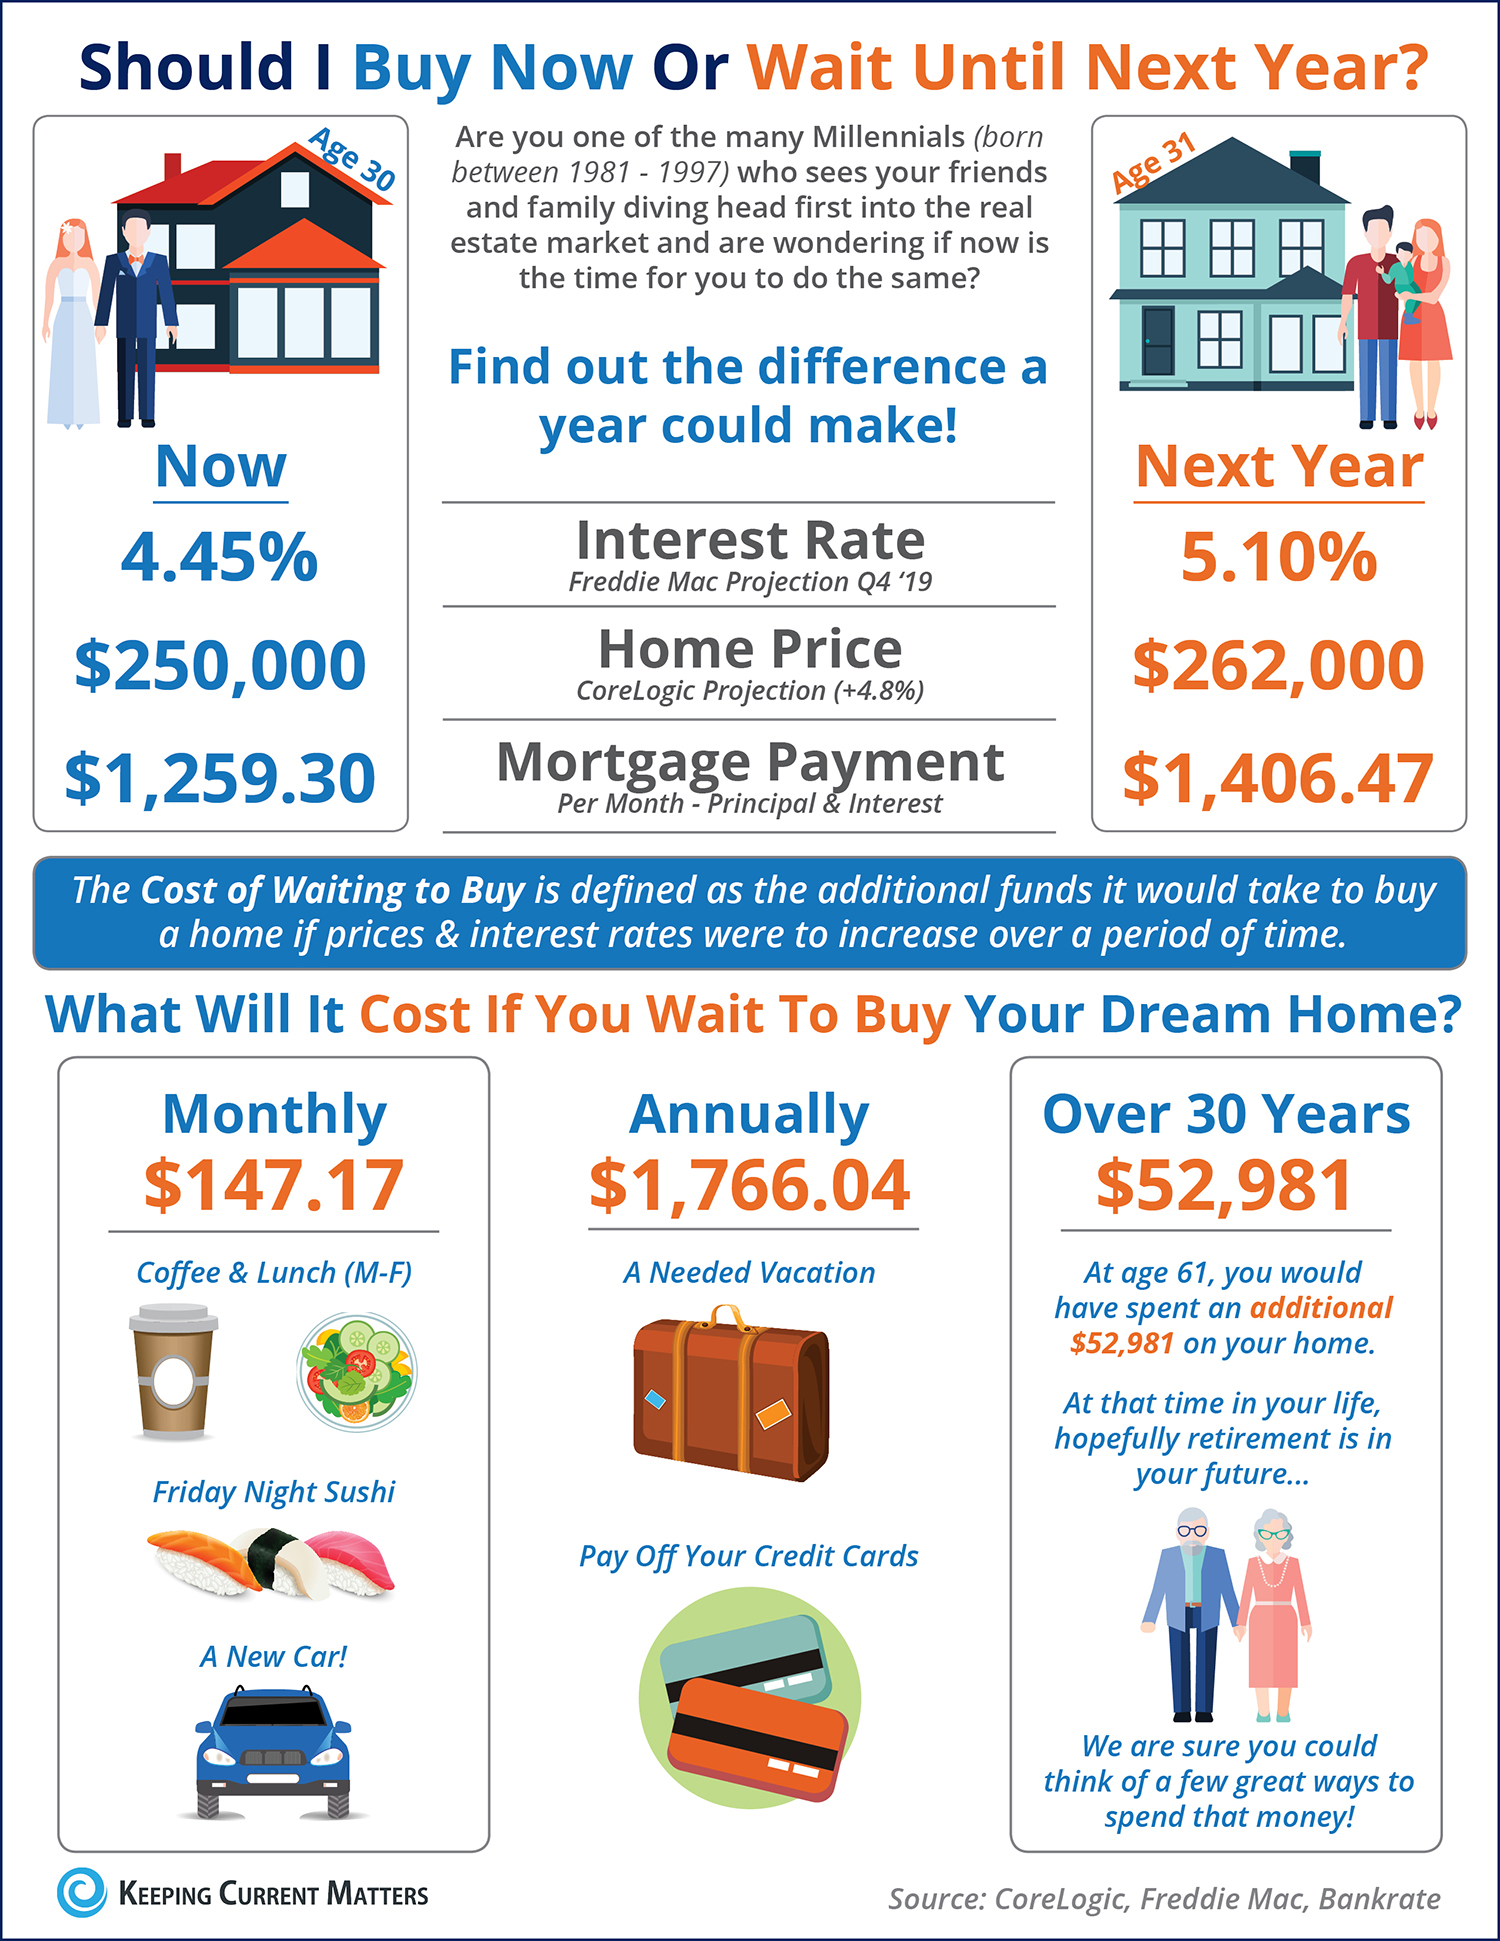
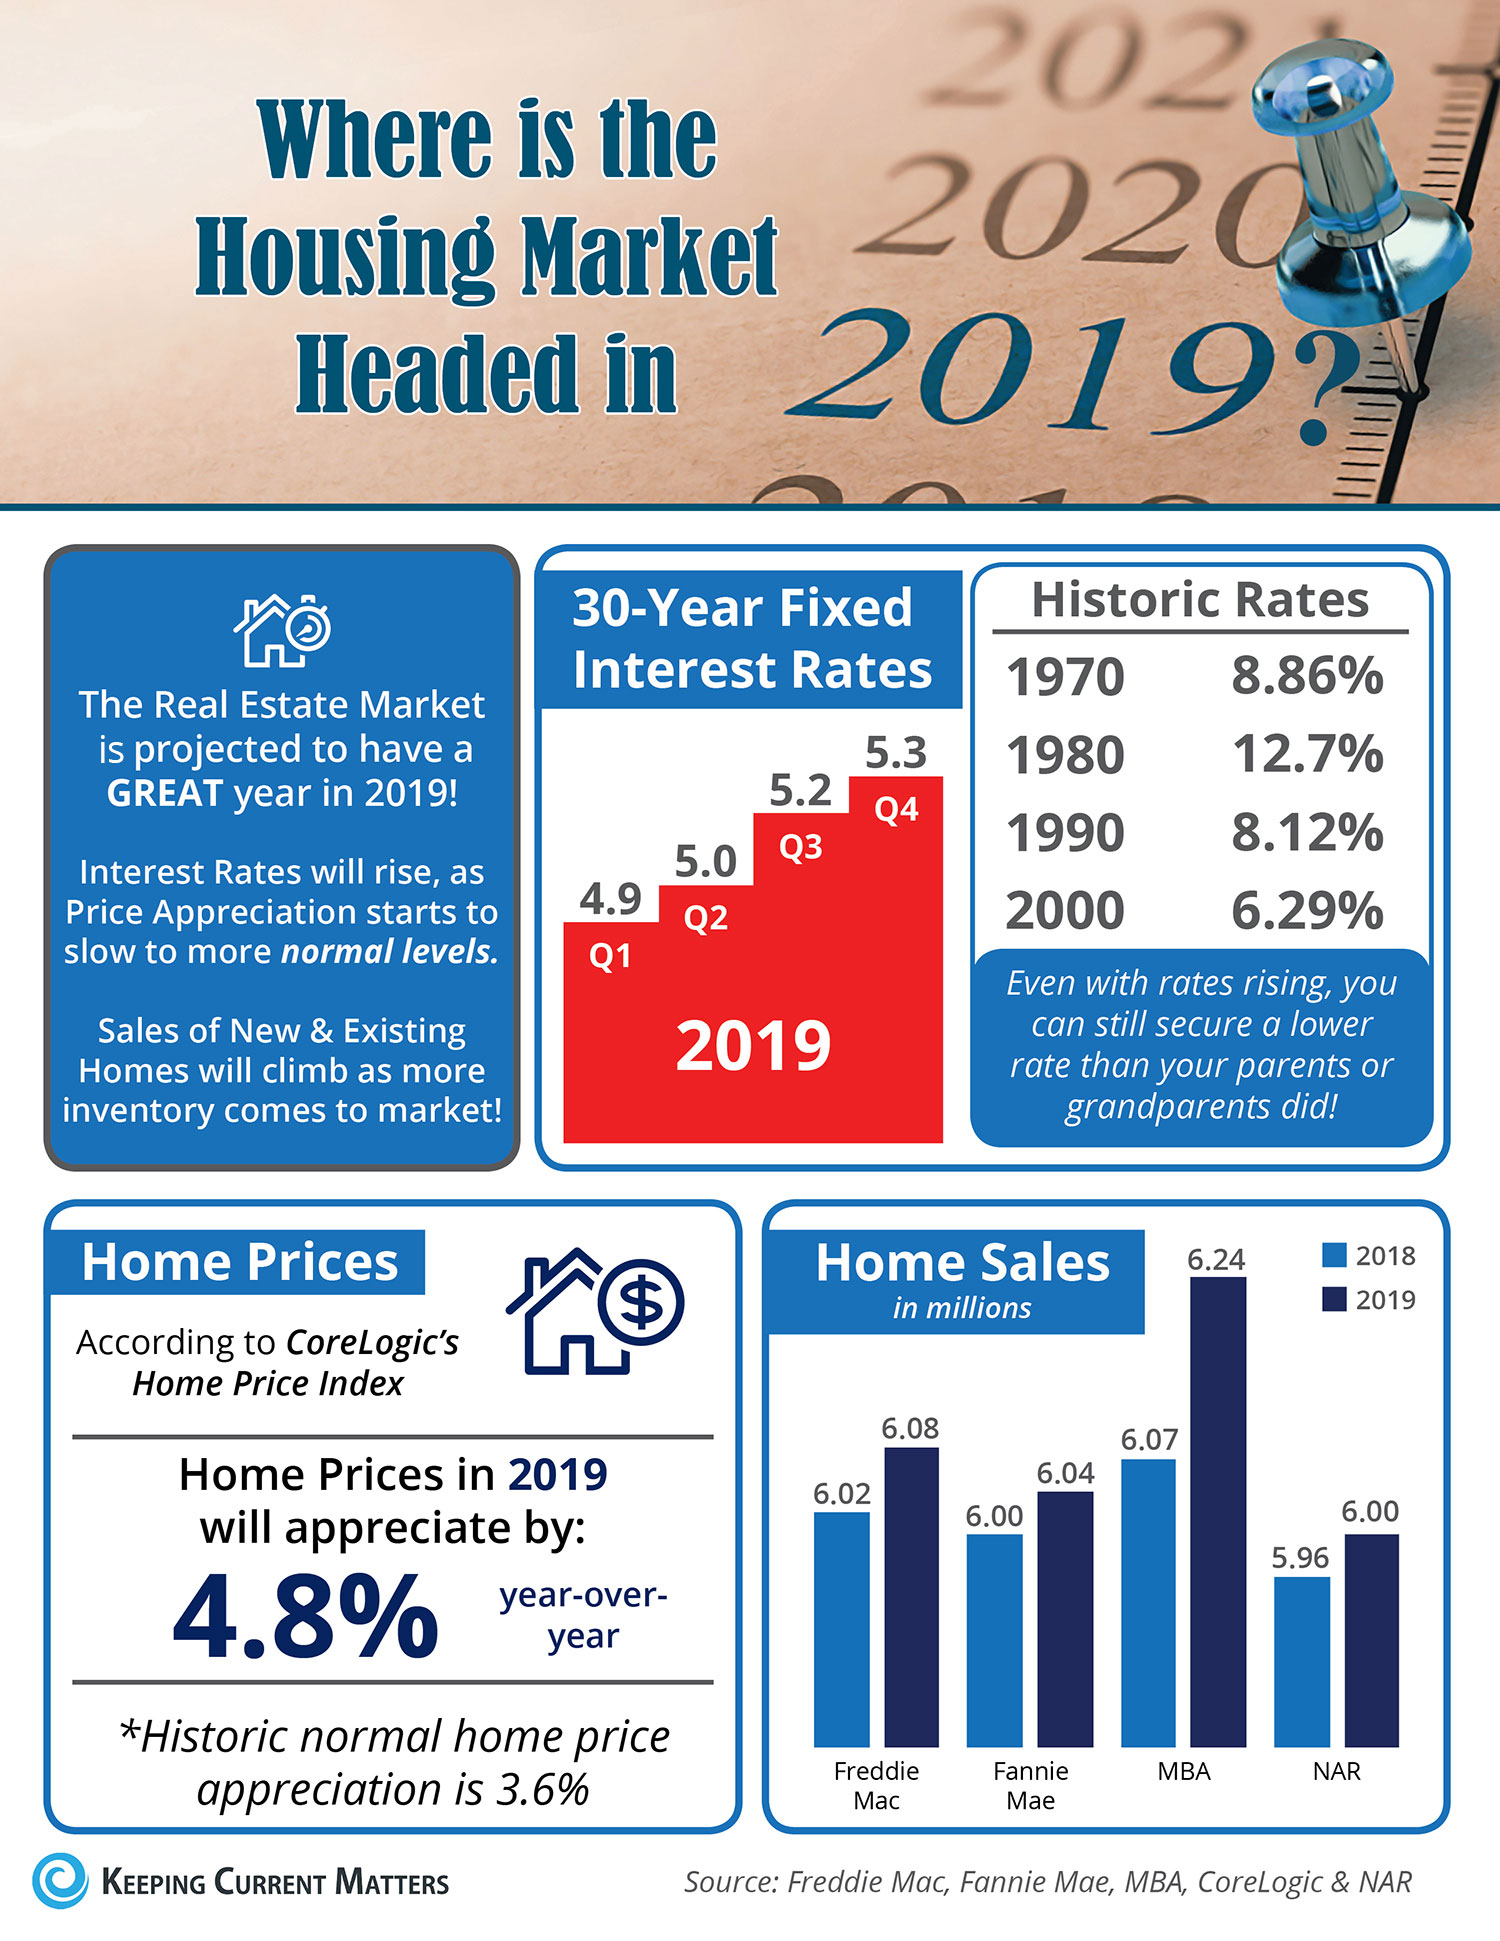
The median existing-home price for all housing types reached a record high of $285,700 in June, up 4.3% from a year ago.

Yun says other factors besides high home prices and inventory shortages may also make buyers skittish. “Either a strong pent-up demand will show in the upcoming months, or there is a lack of confidence that is keeping buyers from this major expenditure,” Yun says. “It’s too soon to know how much of a pullback is related to the reduction in the homeowner tax incentive.”

Here’s a closer look at more key indicators in the housing market in June from NAR’s latest report:

  • Inventory: Total housing inventory rose to 1.93 million in June, up from 1.91 million in May. But the June figure is unchanged from inventory levels a year ago. Unsold inventory is at a 4.4-month supply at the current sales pace.
  • Days on the market: Fifty-six percent of homes sold in June were on the market for less than a month. Properties typically remained on the market for 27 days in June, up slightly from 26 days a year ago.
  • Mortgage rates: The 30-year fixed-rate mortgage dropped to 3.80% in June, down from 4.07% in May, according to Freddie Mac. “Historically, these rates are incredibly attractive,” says NAR President John Smaby. “Securing and locking in a mortgage now—given the current favorable conditions—is a decision that will pay off for years to come.”
  • First-time buyers: First-time buyers comprised 35% of sales in June, up from 31% a year ago.
  • All-cash sales: Sixteen percent of transactions in June were paid in cash, down from 22% a year ago. Individual investors, who account for the bulk of cash sales, purchased 10% of homes in June, down from 13% a year ago.

The Cost of Waiting Until Next Year to Buy

How Long To Save Your Down Payment

Saving for a down payment is often the biggest hurdle for a first-time homebuyer. Depending on where you live, median income, median rents, and home prices all vary. So, we set out to find out how long it would take to save for a down payment in each state.

Using data from HUDCensus and Apartment List, we determined how long it would take, nationwide, for a first-time buyer to save enough money for a down payment on their dream home. There is a long-standing ‘rule’ that a household should not pay more than 28% of their income on their monthly housing expense.

By determining the percentage of income spent renting in each state, and the amount needed for a 10% down payment, we were able to establish how long (in years) it would take for an average resident to save enough money to buy a home of their own.

According to the data, residents in Kansas can save for a down payment the quickest, doing so in just over 1 year (1.12). Below is a map that was created using the data for each state:

What if you only needed to save 3%?

What if you were able to take advantage of one of Freddie Mac’s or Fannie Mae’s 3%-down programs? Suddenly, saving for a down payment no longer takes 2 to 5 years, but becomes possible in less than a year in most states, as shown on the map below.

Whether you have just begun to save for a down payment or have been saving for years, you may be closer to your dream home than you think! I can introduce you to a mortgage professional who can help you evaluate your ability to buy today.

Why Millennials Buy A Home

  • “The majority of millennials said they consider owning a home more sensible than renting for both financial and lifestyle reasons — including control of living space, flexibility in future decisions, privacy and security, and living in a nice home.”
  • The top reason millennials choose to buy is to have control over their living space, at 93%.
  • Many millennials who rent a home or apartment prior to buying their own homes dream of the day when they will be able to paint the walls whatever color they’d like or renovate an outdated part of their living space.

Home Prices Up 5.73% Across the Country

Some Highlights:

  • The Federal Housing Finance Agency (FHFA) recently released their latest Quarterly Home Price Index report.
  • In the report, home prices are compared both regionally and by state.
  • Based on the latest numbers, if you plan on relocating to another state, waiting to move may end up costing you more.

2018 US Migration Report

What is the Cost of Waiting Until Next Year to Buy?

  • The cost of waiting to buy is defined as the additional funds it would take to buy a home if prices & interest rates were to increase over a period of time.
  • Freddie Mac predicts interest rates to rise to 5.1% by the end of 2019.
  • CoreLogic predicts home prices to appreciate by 4.8% over the next 12 months.
  • If you are ready and willing to buy your dream home, find out if you are able to. Contact me: emmanuel@EmmanuelFonte.com 

Where Americans Moved to in 2018

In 2018, Americans were on the move. According to Updater’s annual moving destinations report, Americans moved to cities in every corner of the United States. From Seattle to Denver to Tampa and New York, Americans took advantage of the many diverse cities the U.S. has to offer.

Updater’s moving destinations report is based on aggregated moving trends determined by analyzing 2,000,000 anonymous household moves that took place between Jan. 1 and Aug. 31, 2018. Check out this visual representation of the top 15 most moved to cities in 2018.

read the full post: https://www.updater.com/trends/where-americans-moved-in-2018 

Where is the Housing Market Headed in 2019?

Read the 2019 forecast from Lennox Scott here: http://view.ceros.com/john-l-scott/2019-housing-forecast/p/1